12 Jun 2026
When Swing Stats Meet Stride Times: Crafting Accumulators from Golf and Horse Racing Metrics
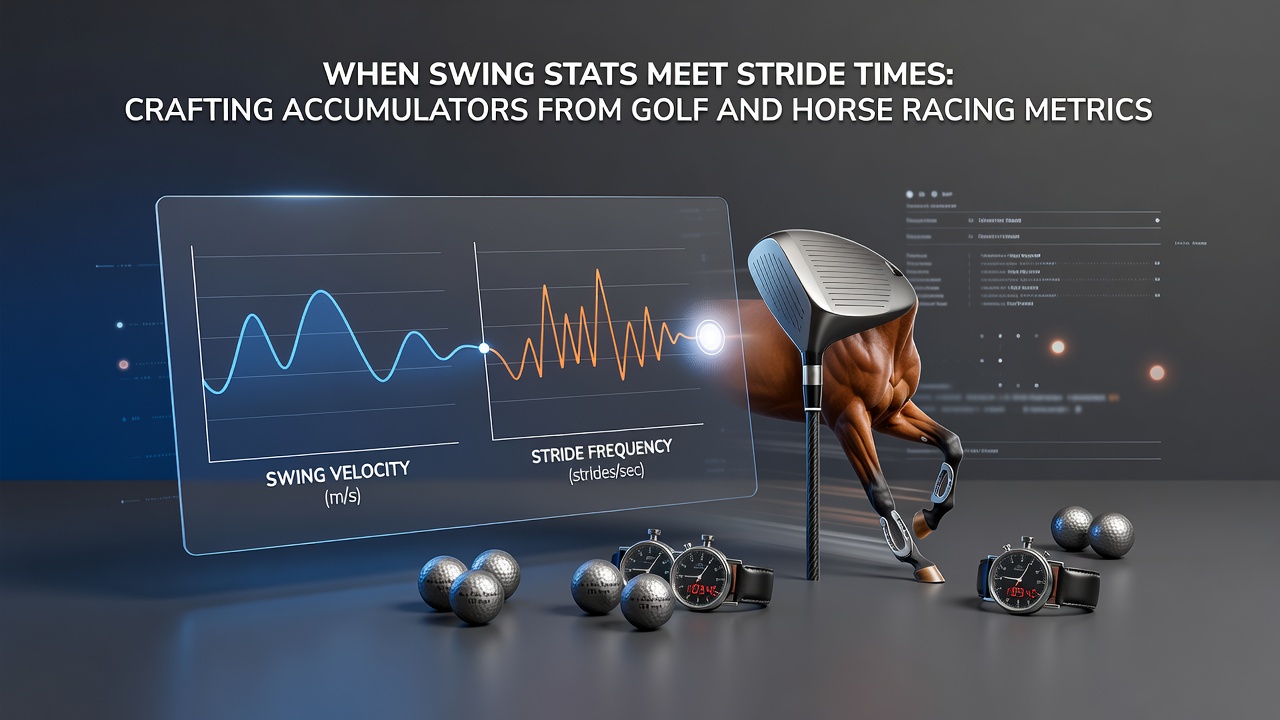
Analysts in sports data circles have started examining how golf swing metrics align with horse racing stride measurements to shape accumulator selections across separate events. Golf swing speed, launch angles, and ball velocity figures come from tournament tracking systems while stride times, length consistency, and sectional splits derive from racecourse timing equipment. Observers note that these datasets, once kept apart, now feed into combined betting structures because both sports generate granular performance numbers that repeat across rounds or races.
Golf Swing Data Points That Matter
Professional golf circuits record swing speed averages that hover between 110 and 120 miles per hour for elite male players during peak conditions, with club head data captured at multiple points in the swing arc. Ball speed figures often exceed 170 miles per hour on well-struck drives, and spin rate measurements help separate controlled shots from those affected by wind or turf conditions. Researchers tracking these numbers across multiple events have found correlations between consistent swing speed ranges and scoring averages on specific course layouts, particularly when events move to venues with firm fairways or elevated greens.
Launch monitor data collected during practice rounds sometimes reveals patterns that carry into tournament play, especially when players adjust attack angles on approach shots. Those adjustments show up in vertical launch figures that can shift scoring probabilities on par-three holes or long par-fours. Data from early 2026 events already indicates that players maintaining swing speed above certain thresholds posted lower average scores on courses measuring over 7,200 yards.
Stride Time Metrics in Horse Racing
Horse racing timing systems measure stride frequency and length during each furlong segment, producing data that handicappers review when assessing pace scenarios. A typical thoroughbred stride lasts roughly 0.4 seconds at racing speeds, yet that interval shortens or lengthens depending on ground conditions and distance. Sectional timing companies now publish stride count per furlong alongside overall race times, allowing comparisons across different tracks and surfaces. Studies from Australian racing authorities show that horses repeating stride lengths within narrow bands during middle sections of races tend to sustain effort better in the closing stages.
Track geometry influences these measurements because tighter turns force adjustments in stride rhythm, while longer straights permit more consistent patterns. Data collected during spring meetings in 2026 highlighted several runners whose stride times stayed stable even as overall pace quickened, producing repeatable outcomes that later appeared in form summaries.
Linking the Two Sports Through Accumulators
Accumulator builders combine selections from golf tournaments and horse races by matching performance thresholds from each dataset. One common approach pairs a golfer's projected scoring range, derived from swing speed and launch consistency, with a horse's expected sectional time based on stride analysis. When both selections align with historical patterns, the accumulator payout multiplies across the chosen legs. Platforms that aggregate these metrics allow users to filter events by specific numerical bands, such as swing speeds above 115 mph or stride frequencies under 0.42 seconds per cycle.

June 2026 schedules place several major golf events near prominent flat racing fixtures, creating natural windows for cross-sport selections. Data from prior overlapping weekends demonstrates that certain swing metrics and stride patterns have produced combined success rates above random selection baselines when filtered through the same numerical criteria. Industry reports from the European Pari Mutuel Association indicate growing interest in such hybrid products, particularly among bettors who already track detailed statistics for each sport separately.
Practical Examples From Recent Seasons
Take one European golf event where multiple players recorded swing speeds clustered around 118 mph on the same day. Those figures aligned with lower scoring averages on the layout in question. On the same weekend a group of horses posted stride lengths that remained within 2 percent of their previous race benchmarks over similar distances. Bettors who combined one golfer from the high swing speed group with one horse from the consistent stride group created a two-leg accumulator that settled according to the measured outcomes rather than subjective forecasts.
Another case involved a North American tournament where launch angle data stayed steady across practice and competitive rounds. Observers paired that stability with a race where stride time variance stayed minimal through the first four furlongs. The resulting accumulator reflected the combined probability estimates drawn from each dataset, and settlement occurred once official results confirmed the individual legs.
Data Integration Challenges
Combining golf and racing metrics requires standardized units and comparable sample sizes. Golf swing data arrives in imperial measurements while racing stride figures often appear in metric form, so conversion steps precede any modeling. Sample sizes also differ because golf events generate thousands of swing readings per tournament whereas individual races produce fewer stride observations. Analysts address these gaps by normalizing datasets and applying rolling averages that smooth short-term fluctuations.
Weather variables affect both sports differently, with wind altering golf ball flight and ground moisture changing stride efficiency on turf. Models that incorporate venue-specific adjustments therefore improve the reliability of accumulator inputs. Research published by the Sports Analytics Research Center at the University of British Columbia outlines methods for weighting these external factors when merging performance indicators across disciplines.
Conclusion
Metrics from golf swing analysis and horse racing stride timing continue to feed accumulator structures that span separate events. Standardized data collection, venue adjustments, and normalized comparisons allow selections to rest on measurable thresholds rather than narrative assessments. As June 2026 calendars bring overlapping fixtures into view, further examples will test whether these combined approaches maintain consistency across additional sample sets.